

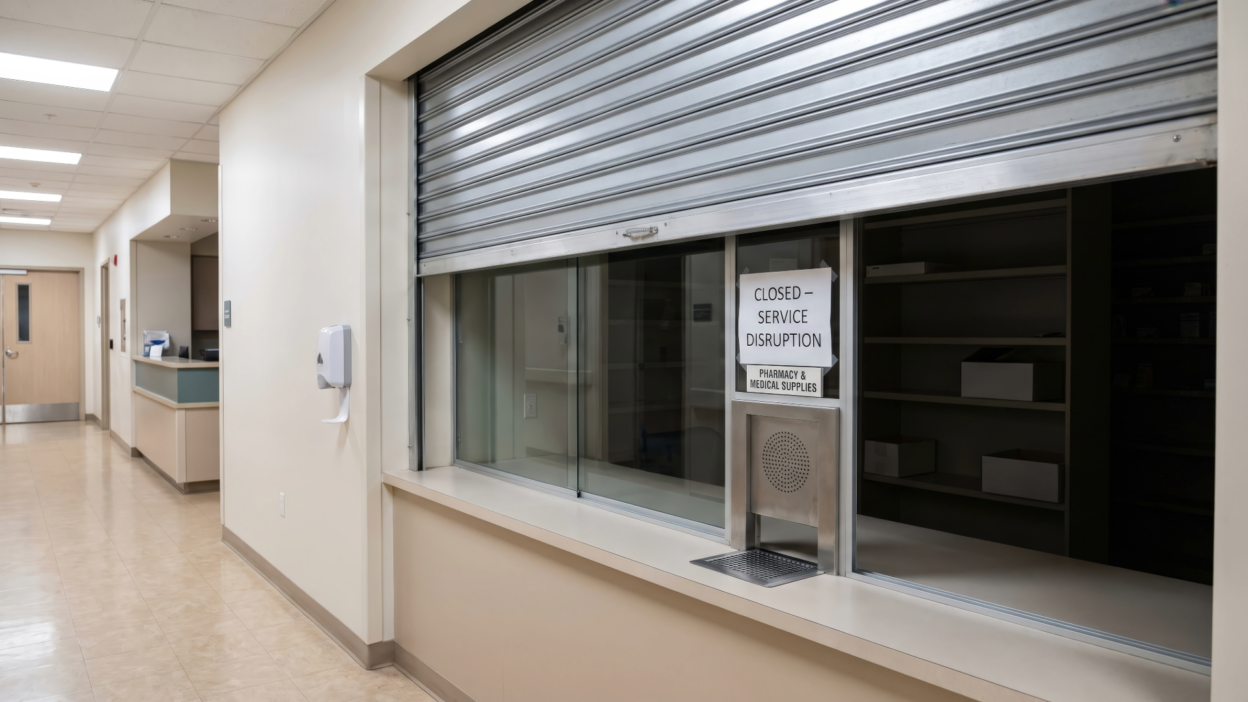
Drug Topics reported a number this week that deserves to be confronted directly: over 300 pharmacy closures in the last three months. A closure rate that, if sustained, represents more than 1,200 pharmacies exiting the market in a single year. And yet, in the same week, independent pharmacies are reporting record clinical service revenue, new payer contracts, and community recognition that was unimaginable five years ago.
The gap between the pharmacies that are closing and the ones that are thriving has never been clearer. And it’s not primarily about location, size, or patient demographics. It’s about financial architecture.
The Three Forces Being Named Precisely
Cardinal Health’s Michelle Britt, in a Pharmaceutical Commerce interview published this week, named the forces reshaping independent pharmacy economics with precision: operating costs are rising, cash flow strain is intensifying as owners pay for inventory today while waiting for reimbursement and rebate dollars to catch up, and reimbursement pressures continue to erode margin.
None of these forces is new. What is new is that all three are operating simultaneously, at intensity levels the pharmacy industry’s current financial architecture was not designed to absorb.
Operating costs are rising through every input. Wages have not retreated from the COVID-era increases driven by pharmacist and technician shortages. Rent, utilities, and technology platform costs have continued their normal upward trajectory. Liability insurance has increased in markets where pharmacy-related litigation has elevated actuarial risk. The cost structure of running a community pharmacy in 2026 is materially higher than in 2020, and it has not been matched by a corresponding increase in dispensing reimbursement.
Cash flow timing is the force most pharmacy owners underestimate until it becomes a crisis. A pharmacy can generate positive gross margin on every single prescription it dispenses and still run out of cash if the timing gap between wholesale payment and PBM reimbursement is not actively managed. The pharmacy pays its wholesaler in 7 to 14 days. The PBM reimburses in 14 to 30 days, sometimes longer. If the pharmacy has grown its prescription volume, it is paying for more inventory faster than it is receiving payment. That arithmetic, compounded across a growing clinical service portfolio where reimbursement cycles can extend further, produces a working capital hole that has nothing to do with whether the pharmacy is clinically excellent or well-managed.
This is a CFO-level problem. Most pharmacists went to school to be clinicians, not CFOs. The pharmacies closing right now are often closing not because their clinical model failed, but because their financial model didn’t account for the cash cycle.
The Long-Term Care Retreat That Creates Market Opportunity
The specific data on long-term care pharmacy contraction deserves its own clinical and business attention.
More than 80% of responding long-term care pharmacies in recent survey data expect to cut services in 2026, a shift that could affect more than 1.6 million vulnerable seniors, disproportionately in rural communities. LTC pharmacy closures and service reductions leave nursing home residents, assisted living patients, and home health beneficiaries with reduced medication management support at exactly the point in their lives when that support matters most.
This retreat creates access gaps. And access gaps are market entry opportunities for community pharmacies willing and operationally ready to absorb those patients.
The pharmacist already profiled in this newsletter’s specialty pharmacy consolidation issue, building local clinical relationships to capture patients that corporate consolidation leaves behind, is executing the same strategic logic that applies here. Every LTC pharmacy that reduces services in a rural county creates a patient population that needs a new clinical pharmacy partner. The community pharmacy with a clinical service infrastructure, a medication review capability, and relationships with the local nursing home and home health agency is the natural successor.
Building that LTC partnership capacity now, before the service reductions fully materialize, positions the community pharmacy to be the first call rather than a fallback option.
The Financial Architecture Difference
The pharmacies surviving and leading in this environment are doing three things simultaneously that the pharmacies closing are not.
They understand their working capital cycle precisely. They know, to the day, their average accounts receivable aging by payer. They know which PBMs pay in 10 days and which pay in 28. They know their wholesaler payment terms and have negotiated the best available. They have established a credit line specifically for working capital management rather than treating it as emergency infrastructure. And they review the cash flow statement monthly, not quarterly, because the warning signs of a cash crisis appear weeks before the crisis itself.
They have diversified revenue before they needed to. This newsletter has covered the revenue diversification argument from every angle across the past year: CGM programs, RPM, pharmacogenomics consultation, biosimilar substitution, diabetic retinopathy screening, GLP-1 comprehensive management, MASLD screening, psychiatric medication review, opioid stewardship. Each of these clinical service lines generates revenue that is structurally independent of dispensing volume and PBM reimbursement rates. When a PBM contract change compresses dispensing margin by 10%, the pharmacy with clinical service revenue absorbs that compression. The pharmacy without it absorbs it fully, against a fixed operating cost base.
They treat every clinical service as a documented, measurable business unit. Not a goodwill activity, not a marketing investment, not a service they “believe in” without financial accountability. Each clinical service has an identified patient population, a documented intervention protocol, a billing code and payer authorization, an outcomes tracking system, and a quarterly financial review that evaluates whether the service is generating positive contribution margin. This is the risk manager identity this newsletter covered in depth: the pharmacist who walks into a value-based care contract conversation with 12 months of documented outcomes data is having a fundamentally different conversation than the one who walks in with enthusiasm and a business card.
The Cash Flow Timing Gap: A Worked Example
A pharmacy filling 300 prescriptions per day at an average drug cost of $40 per prescription pays its wholesaler $12,000 per day in inventory costs. On standard net-10 or net-14 wholesaler terms, the pharmacy owes $120,000 to $168,000 before any reimbursement arrives.
If the average PBM reimbursement cycle runs 21 days, the pharmacy needs 21 days of prescription revenue, approximately $252,000 in accounts receivable, sitting uncollected at any point in time. That is the working capital required to sustain operations at that volume.
If the pharmacy grows from 300 to 350 prescriptions per day, congratulations on the growth. The working capital requirement grows proportionally. The pharmacy now needs approximately $294,000 in uncollected receivables to sustain the new volume. The cash to fund that growth has to come from somewhere: retained earnings, a credit line, or a wholesaler payment term extension.
Pharmacies that close frequently close not because prescription volume fell, but because volume grew faster than working capital. The pharmacy ran out of cash to pay its wholesaler before the PBM reimbursements caught up. This is the specific scenario that Cardinal Health’s Michelle Britt flagged, and it is preventable with basic financial management infrastructure.
The Financial Moves That Actually Differentiate Surviving Pharmacies
Wholesale payment term negotiation is the highest-impact, most underutilized financial lever in independent pharmacy. Most pharmacists accept their wholesaler’s standard net-10 or net-14 terms without recognizing that their dispensing volume qualifies them for negotiation. A pharmacy doing $5 million in annual drug purchases represents a meaningful account for any regional or national wholesaler. Payment terms of net-21 or net-30, available to accounts with strong purchase history, add 7 to 16 days of working capital float without any change in dispensing operations. That float is worth tens of thousands of dollars in reduced credit line utilization annually.
Payer-specific AR aging analysis identifies which PBMs are creating the most working capital pressure. Not all PBMs pay on the same cycle, and not all payment delays are contractual. Some delays reflect claims processing issues that a pharmacy’s billing team can resolve through systematic follow-up. Identifying the specific payers with the longest average payment cycles and escalating those AR aging patterns through the pharmacy’s state association’s PBM advocacy channels is both a financial management action and a compliance action under the CAA’s new transparency and payment timing requirements.
Clinical service billing cycle management is the third lever. Clinical services often have longer and more variable billing cycles than pharmaceutical dispensing, particularly for new service lines where prior authorization or payer enrollment is still in progress. A pharmacist who launches a new CGM education program in month one and starts billing in month one has created a new working capital requirement before the new revenue stream is fully operational. Staggering clinical service launches, ensuring billing infrastructure is confirmed before patient enrollment begins, and tracking clinical service AR separately from dispensing AR allows the pharmacy owner to identify cash flow pressure before it becomes critical.
The Structural Optimism Hiding Inside the Closure Numbers
The 300 closures in 90 days sound unambiguously bad, and for the patients in the communities those pharmacies served, they are. The NCPA pharmacy desert data, covered in this newsletter earlier this year, establishes that 45 million Americans already live in pharmacy deserts, and every closure deepens that crisis in specific geographies.
But the closure numbers also describe a market that is consolidating around the pharmacies that have figured out the new financial architecture. The pharmacies that are closing are disproportionately those that never diversified beyond dispensing, never built clinical service revenue, and never developed the working capital management discipline that the current reimbursement environment requires.
The pharmacies that remain after this consolidation will serve the same patient populations with better clinical infrastructure, stronger payer relationships, more diversified revenue, and more financial resilience than the average pharmacy of five years ago. That is not comfort for the patients who lose their pharmacy in the interim. It is the business reality that every independent pharmacy owner needs to understand to avoid being among the closures rather than among the survivors.
Your Action Before the Weekend
Pull your pharmacy’s current accounts receivable aging report. This report exists in your pharmacy management system right now. Run it, sorted by payer.
For each of your top five payers, calculate the average number of days between prescription dispense date and payment receipt date over the past 90 days. If any payer’s average is over 14 days, you have a cash flow timing gap that is quietly consuming working capital.
Then calculate your total accounts receivable balance for each payer and compare it to that payer’s average daily reimbursement volume. The ratio of AR balance to daily reimbursement tells you how many days of receivables you’re carrying for each payer. High-volume payers with long payment cycles generate proportionally higher working capital requirements.
That audit takes 30 minutes. It produces specific numbers that can be acted on: through wholesaler payment term negotiation, through credit line management, through PBM payment timing advocacy, or through collections follow-up on specific aged claims.
The pharmacies that will still be standing in 2027 and 2030 know these numbers. The ones that are closing often didn’t. Run the report. Know your number. Then act on it before the gap becomes a crisis.
Sources: Drug Topics (300 Pharmacy Closures in the Last 3 Months, August 2026), Pharmaceutical Commerce (Cardinal Health: Financial Forces Reshaping Independent Pharmacy, Michelle Britt Interview, August 2026), Drug Channels (Long-Term Care Pharmacy Survey: 80% Expect Service Cuts, 2026), NCPA (Pharmacy Shortage Area Mapping Tool and Pharmacy Desert Data, 2025-2026), Cardinal Health (Specialty Pharmacy and Independent Pharmacy Financial Management Resources, 2026), NACDS (Pharmacy Market Data: Independent Pharmacy Financial Performance Benchmarks), Drug Topics (Understanding the Restructure of US Pharmacy Benefits Amid Reform and Regulatory Action, August 2026), Buchanan Ingersoll and Rooney (CAA PBM Reform Payment Timing Provisions, 2026)